- Who We Help
-
Capabilities
Product DesignProduct DevelopmentAIGrowth & SupportProduct DesignProduct DevelopmentSoftware DevelopmentWeb Application Development (SaaS, PWA, Portals)Full Stack DevelopmentEnterprise Software DevelopmentDatabase Architecture & EngineeringWeb Development ServicesCMS DevelopmentSoftware Architecture & WireframingMobile App DevelopmentSoftware DevelopmentWeb Application Development (SaaS, PWA, Portals)Full Stack DevelopmentEnterprise Software DevelopmentDatabase Architecture & EngineeringWeb Development ServicesCMS DevelopmentSoftware Architecture & WireframingAIGrowth & SupportSoftware & App Maintenance Website Maintenance Performance Optimization (Speed, UX, Code) App Store Optimization (ASO) Feature Iteration & Versioning Conversion Rate Optimization (CRO) Analytics Setup & Reporting CRM & 3rd Party Tool Integration Tech Support & SLA-based Services Security Audits & Compliance
- Solutions
- Industries
- Design-Ops
- Technologies
- Company
A simple framework to measure ROI for UX
November 20, 2021 | Read Time : 3 mins
Table of Contents
The six steps for justifying better UX, Forrester says that for every $ 1 invested in UX, a company has a return of $ 100. In another study, The Institute of Electrical and Electronics Engineers (IEEE) estimates that more than 1 trillion dollars is invested in IT projects each year and 15% of projects are abandoned before they are completed. This negligible number of failures equates to a loss of 37 billion dollars. Yes, a lack of proper UI can be expensive.
As User Experience designers see the inherent value in improving the experience of products and services. The value of design and how it has impacted the website can be calculated with different metrics. This ensures to keep a check on ensign improvements and get an adequate Return on investment from design.
NN group mentions these four steps to calculate ROI:
- Gather a UX metric in a benchmarking study
- Choose a KPI
- Convert the UX metric into the KPI
- Report the calculation responsibly
Gather a UX metric in a benchmarking study
A product or website equivalent digital asset can be known by its one main feature or multiple features. In a benchmarking study, it is important to figure out which feature to focus on or take the entire project under review. The benchmarking study can be achieved by
- Surveys
- Research
- User interviews
- Market research
- Competitor analysis
- User personas
For the case of ROI based on UX, we will focus on metric samples such as
- Surveys or questionnaires distributed during testing
- Analytics
- Quantitative usability testing
- Customer support
| Surveys | Analytics | Quantitative Usability testing | Customer Support |
| Satisfaction rating | Frequency of return visits | Frequency of return visits | Customer- support tickets |
| Ease-of-use rating | Feature usage | Feature usage | Phone calls, chats, emails, texts |
| Perceived usability | New accounts or visitors | New accounts or visitors | Training hours required |
| Questionnaire scores (NPS, SUS, SUPR-Q) | Returning visitors | Renewal rate | |
| Churn | Churn | ||
| Completion rate | Completion rate | ||
| Error counts & rate | Error counts & rate |
Choose a KPI (Key Performance Indicator)
A KPI is an essential tool to achieve desired goals. KPI helps the company refine and justify their plan, which they most care about. Choosing a KPI is to bring everyone in the team/company together to achieve the same goal, which ensures the growth and performance of the company.
KPI depends upon the company’s long-term and short goals.
Examples of KPI:
- Profit
- Cost
- Customer lifetime value (CLV)
- Employee-Turnover Rate (ETR)
- Employee productivity
- Donors & donor growth
KPIs can also be measured in terms of value by design or user experience. The ROI cares about how the design impacts what the company cares about. Here stakeholders have to think about aligning both user and KPIs
For instance, UX KPI can be % of people subscribed to the newsletter. The underlying business goal is that by subscribing, the customer has also enabled notification and has provided an email address indicating the consent to be engaged and communicated with.
Here the business goals aligned with customer goals ensure the company collects emails of potential customers, and users get exposure to services by the brand.
Convert UX metric into KPI
ROI of the UX is when one metric is converted into another metric. This metric presents how the design impacted the growth and business performance.
Conversion rate/ratio is when a customer visits the website, completes a course of action, and signs up for the newsletter. Here the conversion rate can be easily calculated.
For example, 30 people visit the website and 20 people sign up for the newsletter. Here the conversion rate is 66.6%.
Calculation: Conversion rate = (conversion/total visitors)*100
In other cases, the conversion rate calculation can be complex, as every metric is not related to how many users are signing up, but what is their experience and action, and how it impacts the company goals.
Report Responsibly
As mentioned above, different metrics are calculated with their formulas. Conversion rate and dwell time cannot be calculated with the same formula and presented in the same chart.
The documentation of the research and findings has to be as detailed as the team wants, it should not just show figures but how and why it happened.
Here at OriginUX, we believe in documenting research that is strong and visually presented.
For example:
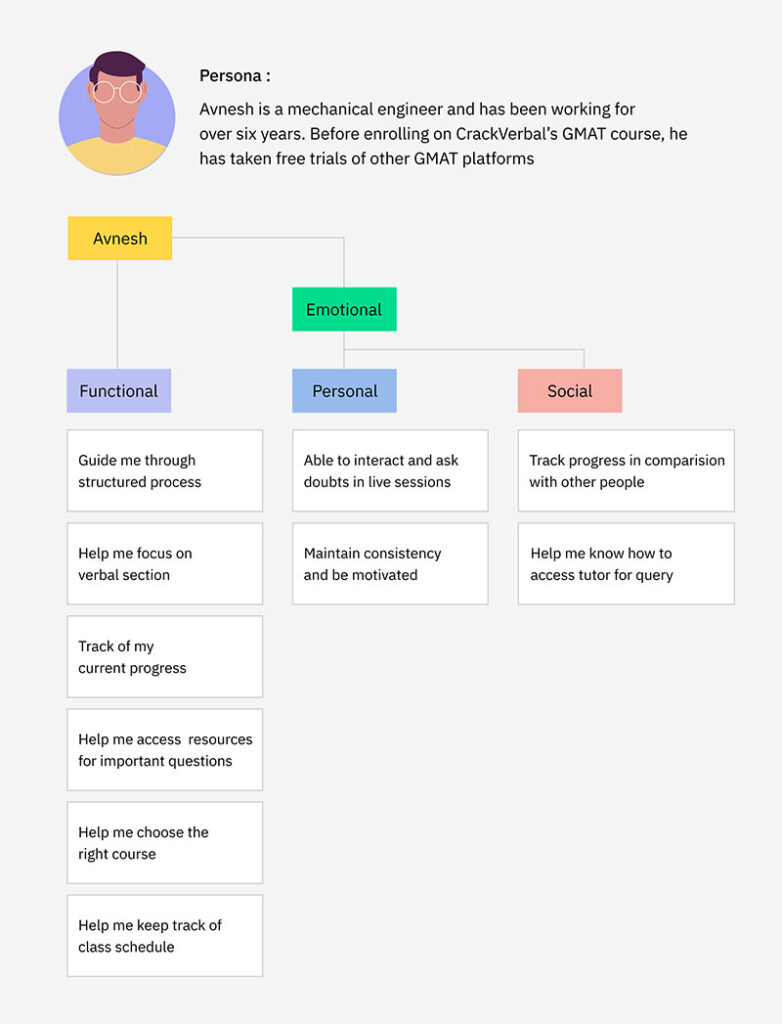
Here is an example of how the user interview was documented for an e-learning website project.
Guide on how to measure in a framework:
The HEART framework by Google is one way to calculate one feature or the entire website ROI from UX.
| Goals | Signals | Metrics | |
| Happiness | Users find the app helpful, fun and easy to use | | |
| Engagement | Users enjoy app contents and keep engaging with it | Spending more time in the app | |
| Adoption | New users see the value in the product or new feature | | |
| Retention | Users keep coming back to the app to complete a key section | | |
| Task Success | Uers complete their goal quickly and easily | | |
To learn more about Google’s HEART framework, visit the blog where we extensively explain how the framework works and help in calculating metrics of small features to the entire website.
The importance of UX design cannot be overstated; pie charts and sophisticated computations cannot do it justice. Remember this the next time you visit Disneyland or use Google; there are successful organisations that have established their reputations on design thought.
“We need to stop worrying about proving the value of design and just focus on outcomes that provide value”
– Denis Weil
For many businesses, embracing UX design is as simple as replacing bad design. Poor design can result in costly and time-consuming support calls, as well as lost revenue and increased development costs. The Covid-19 epidemic has resulted in numerous success stories of well-designed experiences and applications assisting individuals and businesses.
Perhaps it’s time to reconsider the entire premise of questioning design’s return on investment and start constructing a better world?
AUTHOR
Team OriginUX
OriginUX Studio is a CoE for User Experience providing UI & UX across Product, Service and Customer Experience Design. We are a cross-disciplinary design team that loves to create great experiences and make meaningful connections for businesses and their users through UI & UX.
Founded in 2016, our larger purpose is to help brands understand what they want to do and where they want to go. To do that we have to make understanding customer experience simple, effortless, and affordable for everyone.
Related Articles

June 12, 2021
Eye-opening insights on how to measure ROI for UX
Reading about UX and how it impacts your website is trending charts. Everyone is aware of how UX plays...

February 14, 2021
How to measure ROIs with UX, and how organizations are struggling with it
Researching and implementing UX design will bring good business, but success to every business is when you can measure...
December 5, 2020
ROI for UX in an Enterprise Organization
What is an Enterprise Organization? An enterprise is a business venture established to carry out business activities such as...
OriginUX studio is based out of Bangalore, India.
We are a cross-disciplinary design team that loves to create great experiences and make meaningful connections for businesses and their users through UI & UX.
Industries we serve
© OriginUX Studio 2016 - 2026